When it comes to Big Data processing, Amazon’s Elastic MapReduce (EMR) is one of the most popular services available. A cloud-based platform that integrates popular Big Data frameworks like Hadoop and Flink with other AWS services like S3 and DynamoDB, EMR provides a cohesive, powerful platform for working with large datasets.
But with Big Data comes big responsibility. In order to make the most of EMR, it’s important to stay on top of the health of your EMR cluster using an EMR monitoring platform like Metricly. In this article, I show how.
Understanding Amazon EMR’s Architecture
Before we get into how EMR monitoring works, let’s first take a look at its architecture.
Within the tangle of nodes in a Hadoop cluster, Elastic MapReduce creates a hierarchy for both master nodes and slave nodes. As is typical, the master node controls and distributes the tasks to the slave nodes. In the context of AWS, both master and slave servers run in EC2 on Linux and use S3 buckets for storage, while CloudWatch is used for collecting metrics.
Hadoop itself runs as a cluster of virtual servers and distributes processing across them. EMR adds value to Hadoop by automating most of the management and configuration tasks for Hadoop. It makes all the computing infrastructure available in a way that lets the customer focus on the rest of the business.
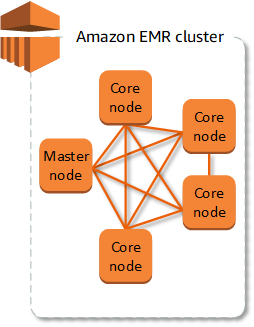
Because of the hosted architecture behind EMR, it is also possible to resize clusters as needed. This scaling can even be scheduled to happen at certain times when high utilization rates occur. To give a better idea of how EMR is structured, let’s take a look at Amazon’s own graph:

Source: docs.aws.amazon.com
The core node performs tasks and stores the data with the Hadoop Distributed File System (HDFS), and distributes the data to the servers in identical copies for protection against failures and losses. There is also a task node, which is considered optional—Its role is to execute tasks and send the results to the slave node that is managed by the master. All work processes are defined by EMR as steps, which may run on one or more Hadoop clusters.
Managing EMR Processes
EMR processes have a life cycle. Instances are born, executed, and then die. This life cycle begins when a task is chosen to run on Elastic MapReduce—at which point, the cluster state has started. The next step is setting up the task, which typically involves installation, configuration and/or execution of some sort of script.
The next step in the state of the working cluster is when the actions are executed successfully. In the configuration, we need to first consider whether the cluster will be configured as long duration, deactivated at the end, or if the KeepJobFlowAliveWhenNoSteps parameter in the API will be applied.
This parameter tells the cluster to maintain a waiting state after the success of the previous step, when there are no more tasks to execute. Otherwise, after completing the task, it shuts off and goes into the finished state—so it is no longer possible to get the data processed by it unless the information has been stored in an S3 container.
The tricky thing about EMR is that failures during any of the processes discussed above can also cause the cluster to shut down, often leaving you with no way to recover data. There are ways to safeguard against this, however. For example, you can enable termination protection, or you can provide an ActionOnFailure in the configuration step that allows a way to retrieve stored data. If this sounds complicated, it kind of is, but the flowchart below should clear things up a little bit:

Source: docs.aws.amazon.com
Configuring Metricly for Amazon EMR Monitoring
If you’ve read this far, you understand that EMR life cycles are relatively complex. Managing them effectively is not a task that you can do manually—and if you don’t manage them effectively, you risk losing data permanently.
This is where a tool like Metricly comes into play. We make EMR monitoring easy by allowing you to easily monitor your EMR environment and identify performance problems before they disrupt your EMR workflows.
- To monitor Amazon Elastic MapReduce with Metricly, first log in to your Metricly account and navigate to the Amazon Web Services Integration configuration panel.
- If you haven’t yet connected Metricly with your AWS account, follow the setup instructions presented on the AWS Setup page before continuing.
- Once we’ve successfully connected Metricly to AWS, we can then set up the EMR integration. The simplest way to do this is to check the EMR box on the same AWS Setup page:
 Enable AWS EMR Monitoring in Metricly
Once Metricly starts pulling data in from EMR, the sheer number of items that are tracked can be overwhelming at first. There’s application statuses, containers, HDFS, memory usage, nodes, S3 read/write tracking—Who knew Big Data created so much… data? Thankfully, Metricly helps cut through the clutter with their pre-configured dashboards.
As an example, the default EMR Summary dashboard gives you an overview of the number of EMR cluster instances you are running, the top five instances based on HDFS utilization, and the top five instances based on concurrent data transfers. While this is a great start, I highly recommend browsing the “Add Widget” modal for more appropriate metrics and graphs for your particular EMR use case.

EMR Summary in Metricly
Automated Alerting
As with all monitoring, one of the most important ways to stay on top of things is targeted alerting. While the details of Metricly’s alerting functionality are outside the scope of this article, it is important to know where to configure this functionality.
 Metricly Policies for EMR Alerting
In “Metricly-speak,” setting up alerts happens underneath the “Policies” section of your Metricly account. As with Metricly’s dashboards, a few started policies are created whenever you add a new integration. As an example, one of the default policies created for EMR is the Idle Cluster Warning, which triggers a notification whenever an EMR cluster has been idle for at least the past hour.
Conclusion
EMR is a painfully complex tool, with enough metrics to run a second Big Data cluster, but with Metricly, the process of monitoring and analyzing the health of your EMR clusters is massively simplified. While Metricly provides enough tooling out of the box to get you up and running in a matter of minutes, its true power is just how customizable it is. With the ability to define dynamic dashboards and advanced alerting policies, Metricly is a robust tool that is up to the task of monitoring anything you throw at it.
Metricly coaches users throughout their cloud journey to organize, plan, analyze, and optimize their public cloud resources.
Try Metricly Free


