
“Our AWS bill is 50% higher than it was last year. Can increased workload alone account for this figure?”
Sometimes the question isn’t whether or not you’re doing enough to capture savings. But how do you convince management that your resources are being properly utilized when the cloud bill keeps going up?
Registering every time you downsize an EC2 or adjust reservation purchases isn’t very practical. Even a complete list of specific actions doesn’t address the underlying concern: how do we know missed savings don’t account for a large portion of the hike?
Validating your infrastructure optimization efforts and communicating them effectively requires an uncomplicated visualization—not a series on Amazon’s multitude of EC2 offerings or performance monitoring.
Escape the Weeds Using Normalized EC2 Performance Data
A visualization for tracking optimization must achieve two things:
- Expressing utilization of resources over time
- Comparing that utilization to total-cost over time
This approach purposely avoids the details of individual or groups of EC2s by normalizing data to the CPU-level across your environment. Per-instance utilization trends upward as you right size resources and remove unused capacity; per-CPU cost trends downward as you make reservations where appropriate.
Turning Trends Into Efficiency Index Scores
As you improve cloud cost management by dividing average utilization by average cost-per-element, you can create a single score which demonstrates increased efficiency regardless of rising or waning total cost over time. This creates a simple, transparent way of updating management on the cost-effectiveness of your resources over time. You can use this data to initiate optimization projects, validate completed projects, and monitor overall cost-effectiveness as your workloads increase or change throughout the years.
Don’t want to do all of this calculating by yourself? Metricly captures requisite performance metrics for your resources and tracks cost in our Efficiency Index tool.
Don't have a Metricly account yet?
Start your 21-day free trial, to begin using our Efficiency Index Tool!
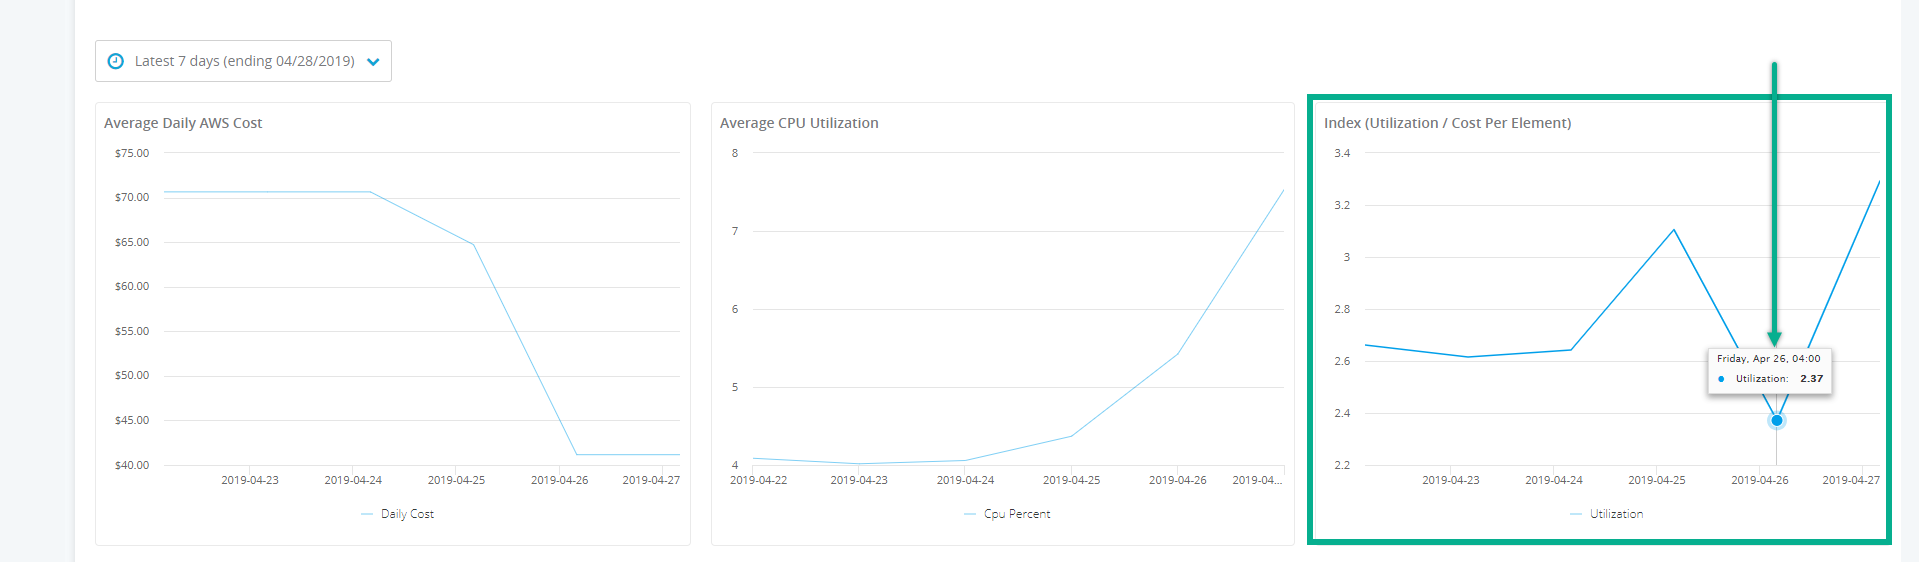
You can view your Efficiency Index scores for each day across multiple time periods using the Quick Ranges dropdown.
Expanding Indexing Across More Dimensions
This same principle can be applied to other resource dimensions, such as memory and IOPS, and even to service offerings such as RDS and Lambda. Keep an eye out for more feature announcements around the Efficiency Index tool!
Metricly coaches users throughout their cloud journey to organize, plan, analyze, and optimize their public cloud resources.
Try Metricly FreeAbout the Author

Cody Tipton
Cody is a Platform Support Engineer at Metricly. When not helping organizations reduce their cloud spend, he can be found gardening or armchair critiquing old films and television.


