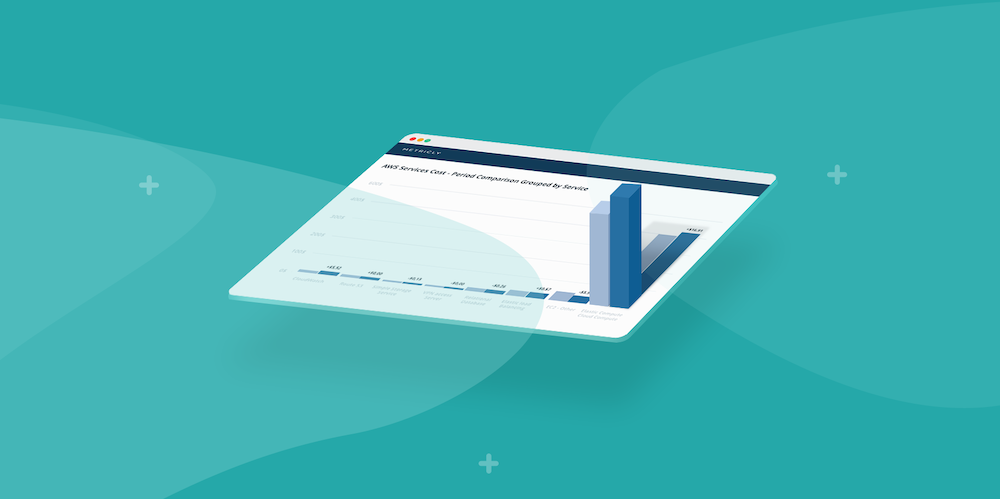
Being an AWS shop ourselves, we at Metricly understand the impact AWS costs have on business. Last year, we demystified AWS billing with our EC2 cost report, and followed that up with tailored EC2 recommendations to help you get the most from your AWS spend. Now, we’ve taken it one step further, replacing the old EC2 cost report with some truly innovative improvements in a new EC2 cost report. Read on to see what’s new!
Compare EC2 Cost and Performance Over Time
AWS cost data is great – but being able to compare cost and performance over time is even better. The old report updated weekly, but our new EC2 Cost Report is updated daily and can show aggregated cost and utilization performance data across any range from a single day to an entire month. Simply select the period you would like to view from the time controls at the top right:

Once you’ve selected your timeframe, you can explore cost differences between EC2 instances in the element or scatter plot views, or compare costs and performance day over day, week over week or month over month. These options are available depending upon how long data has been compiling, as well as the time period selected:

You can even see how the cost and performance has changed for an individual EC2 instance over time by combining the view with element filters (in this example, cost is represented by the bars and the lefthand axis, while performance metrics are represented by the dots and the righthand axis):
Predict Monthly EC2 Costs
The new EC2 report takes your cost data one step further, allowing you to extrapolate current EC2 costs to the end of the month and see how they compare with the previous month. Like the old report, you can filter the selection to any subset of your EC2s, to see how certain parts of your environment will impact your overall monthly bill. Here it looks like we’re tracking to spend 25% more on ‘dkr’ elements this month compared with last month:

EBS Costs, Simplified
Our EC2 cost report is now more than just EC2s – we’ve added cost data for all EBS instances that are linked to EC2s. (Note: AWS does not associate EBS snapshot costs with an EC2 currently, so we can’t include those costs just yet.)
We’ve also simplified the data transfer cost categories, to make it easier to see the impact these costs can have on your AWS bill. Don’t forget – you can click the legend to toggle categories on or off. This allows you to isolate only your EBS costs, for example, or to see only costs associated with on-demand instances.
Improved EC2 Cost Report Filters
The report displays the top 20 most expensive elements by default, but you can expand or remove the filter altogether to show more elements. Sort and add further filters to find EC2s that meet more detailed cost criteria (if you wanted to see only spot EC2s costing more than $200, for example). All of this combines to give you more insight into your AWS bills than ever before.

Ready to dive into your EC2 Cost Report for unique AWS billing insights? Try it out with Metricly’s 21-day, no-obligation free trial.
Metricly coaches users throughout their cloud journey to organize, plan, analyze, and optimize their public cloud resources.
Try Metricly Free


